Google Analytics is widely used among businesses and has often been hailed as the best, free tool to track website behavior.
However, if you are not very familiar with website analytics, the platform can be quite daunting – it is full of jargon, has an overwhelming amount of data, and is difficult to understand. You could be in there for hours and still not have a concrete idea of how to improve your digital marketing efforts!
KWSM: a digital marketing agency takes care of the digital marketing of many different business owners. We fully understand that running your business is your primary concern and you do not want to spend your whole afternoon watching Google Analytics tutorials to understand the whole system. All you need is the basics to grasp if your website is performing well and if your digital marketing is working.
With that being said, below are the 6 most important key metrics to track on Google Analytics to know what the behavior is like on your website.
 1. Source & Medium = Where Your Website Traffic is Coming From
 1. Source & Medium = Where Your Website Traffic is Coming From
A quick overview of how people found your website can be reviewed under the “Aquisition” tab > Reviewing “All Traffic” > Checking out “Source/Medium.”
What this does is it sorts all your website visitors into groups of where they came from. If you are marketing on multiple social media websites (for example LinkedIn, Facebook, Twitter, etc.) or if you are trying to get people to explore the website via your monthly email, this tab allows you to see how many people came to your website from those different marketing efforts.
The source is often a little bit more varied depending on the nature of your business, but Google Analytics will automatically sort your website visitors into 4 types:
- Paid = Anyone who found your website via an online advertisement or PPC effort (an example ‘Source’ = Google Ads)
- Organic = Anyone who found you through a search engine (an example ‘Source’ = Google) without you spending on showing up. This would be considered your search engine optimizations (SEO) marketing.
- Social = Anyone who found your website via social media (an example ‘Source’ = Facebook)
- Referral = Anyone who found your website through an email or other websites/listings that feature you (an example ‘Source’ = Yelp)
2. Sessions vs. New Users = How Often Are They Coming to Your Website
Now that you understand the places your website traffic is coming from, you will want to understand who they are and how often they come to your website. First, you will want to change the time frame in which you are looking at your data. We recommend setting it to the last 30 days, or until you have at least 100 “sessions” to review.
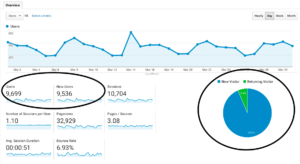
On the overview page, you can find all the main stats to give you a great view of your site’s health. You can view new vs returning user by looking at the pie graph, or compare the three stats “Users,” “New Users,” and “Sessions” to give you a number comparison. Each person who comes to the site during the selected time, regardless of whether they have visited the site before, count as a user. Then every time it is a completely new person visits, it counts as a new user. Every time a user comes to your website, it counts as a session. It is very likely that you will have more sessions than users, because there are some people who will come to your website more than once.
These numbers should give you an idea of who these people are and how often they are on your website. It provides you with a bird’s-eye view of which sources and mediums are bringing you the most website visitors, so you can determine which marketing tactics are working.
3. Bounce Rate & Avg. Session Duration = How Long Do They Stay
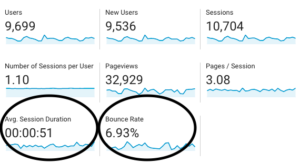
Finally, let’s zoom in on two more stats from the overview page now that you know who they are and where they came from, you will want to understand what they did on your site. The length of time they stay on your website is a big indication of their intent. If they are only staying for 3 seconds, you may want to ask yourself if people like your website.
One way to tell if you people like your website is by reviewing the ‘Bounce Rate.’ The bounce rate is the percentage of users who navigate away from the site after viewing only one page. If your bounce rate is much higher than 60%, there may be something wrong with the messaging on your website.
Secondly, you will want to check the ‘Average Session Duration.’ It is fairly straightforward, but this measures the minutes and seconds someone stayed on your website. Like the bounce rate, if you see the average duration on the website is only a few seconds you may need to ask yourself why your website visitors are leaving so quickly. In most cases, it only takes a few small website edits to get people to stay longer!
Learn more about four other metrics to keep an eye on in Google Analytics.
Questions? Ask KWSM: a Digital Marketing Agency
It is our hope that this blog brought you some clarity and made a rather daunting task a little bit easier for you. However, if you have remaining questions or would like some help getting set up with your Google Analytics basic knowledge, you can always contact us.
![]() Today, nearly 40 million sites use Google Analytics.
Today, nearly 40 million sites use Google Analytics.
Are you ready to harness the power of Google Analytics to understand if your website is converting visitors into customers? Empower yourself to understand where your traffic is coming from and what actions they are taking on your website.
CLICK HERE to sign up for a complimentary 30 Minute Website Audit